PUBLIKÁCIÓK ÉS PREZENTÁCIÓK
Előkészületben:
Bátorfy Attila: Az információ ábrázolásának történeti kutatása
Kolozsvár: Erdélyi Múzeum Egyesület
(várható megjelenés: 2022 második fele)
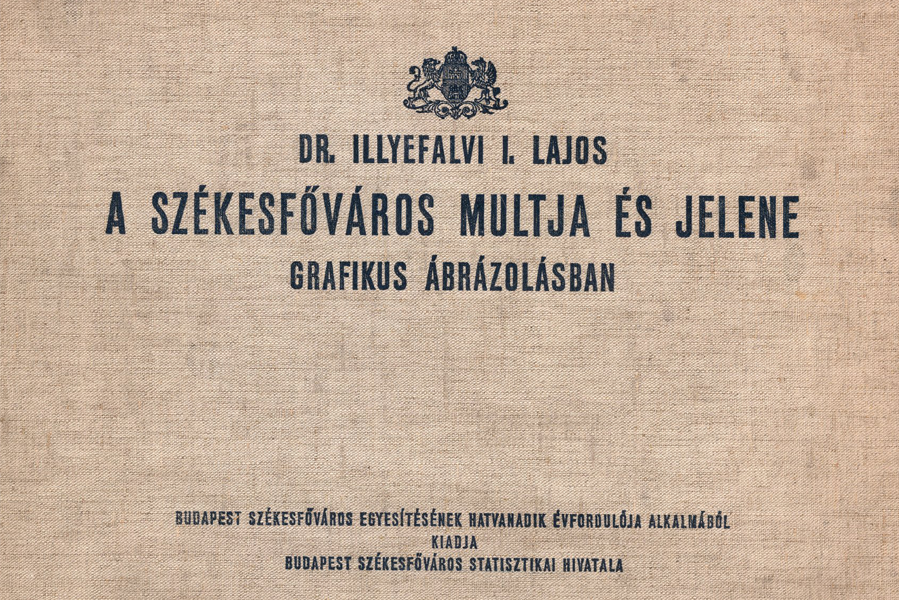
Bátorfy Attila: Illyefalvi I. Lajos három grafikus budapesti statisztikai albuma és azok aktualitása
In Tanulmányok Budapest Múltjából
(várható megjelenés: 2022 ősz)
Bátorfy Attila: Az adatvizualizáció második aranykora – nemzetközi és hazai kitekintés
In Bordács Andrea (szerk.): Illusztráció, vizualizáció a tudományban, oktatásban és művészetben. Szombathely: ELTE BDPK
(várható megjelenés: 2022 ősz)
This paper aims to present the improvements of data-driven, visual journalism in Hungary in the past twenty years, comparing it with international trends and tendencies. The roots of data journalism can be traced back to anglo-saxon origins, around three hundred years ago. Today the genre is present in the newsrooms of many countries, including Hungary, although here, the practices fall behind compared to international news sites and papers. To verify the assumption that Hungarian tendencies in data journalism are underdeveloped as opposed to international ones, semi-structured interviews were conducted to prove the initial hypotheses.
Szabó KrisztiánMédiakutató 2022 nyár. 15–34. oldal
primer kutatás
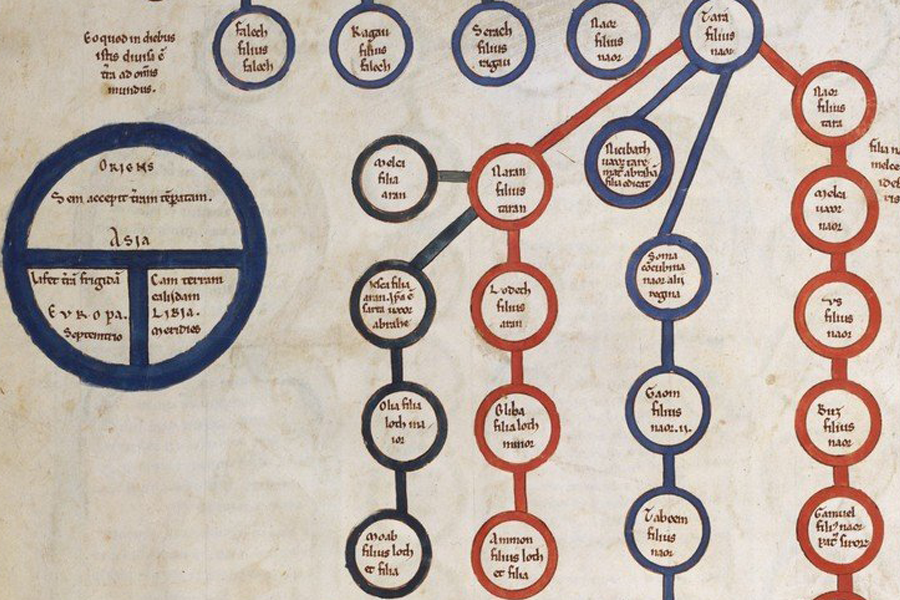
While the long history of the study of lists and Listenwissenschaft resulted numerous findings and theories of its cognitive origins, cultural significance, functionality and use, there are surprisingly only a few accounts about the diverse graphic methods of presenting lists. In my essay I examine the visual representation of lists in a historical perspective. My commentary is based on previous information graphics taxonomies and I propose a simple framework to classification of the visual forms of lists.
Bátorfy AttilaBelvedere Meridionale vol. 34. no 2. 19–32. oldal
doi: 10.14232/belv.2022.2.2
tanulmány

Bátorfy Attila
Digitális Bölcsészet 2021/4. 7–10. oldal
doi: 10.31400/dh-hun.2021.4.3132
recenzió
Bátorfy Attila
Nightingale 2021. 06. 10.
ismeretterjesztő közlemény
Bátorfy Attila
Nightingale 2021. 05. 13.
ismeretterjesztő közlemény
Bátorfy Attila
Nightingale 2020. 04. 09.
ismeretterjesztő közlemény
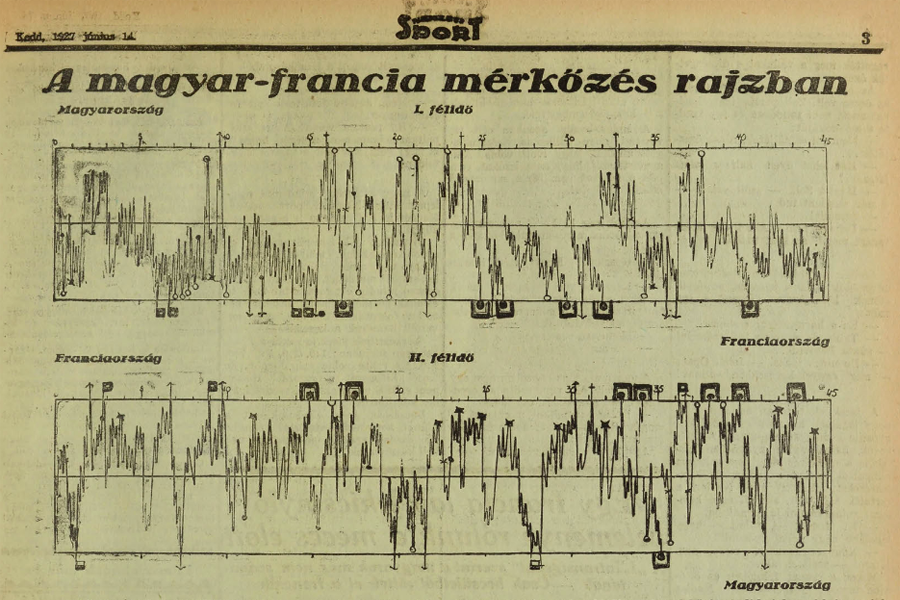
The match graph, the target table, and the directional target table by Nemzeti Sport (1922–1942).
Bátorfy Attila
Nightingale 2021. 02. 24.
ismeretterjesztő közlemény
Bátorfy Attila
Nightingale 2021. 02. 18.
ismeretterjesztő közlemény
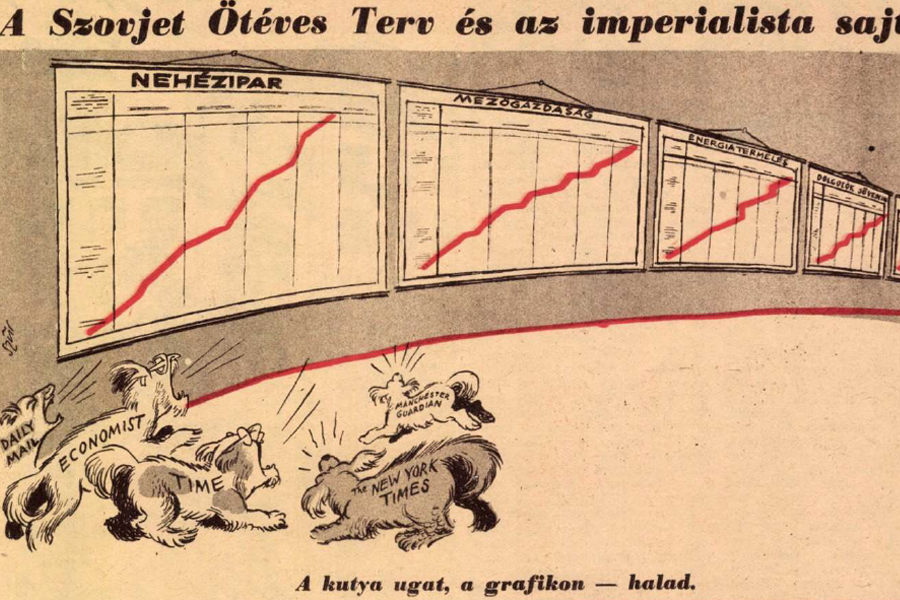
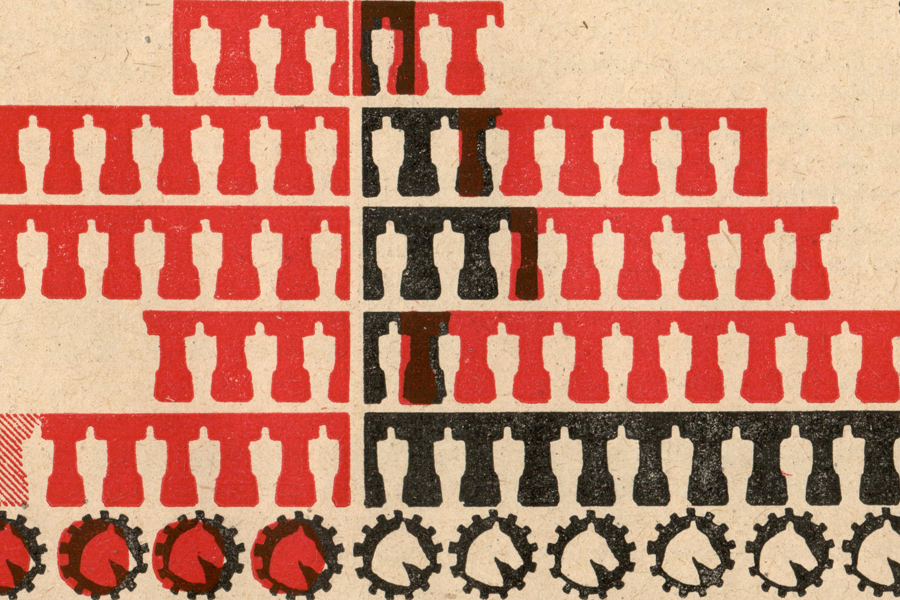
Cartoons showing charts in the service of communist propaganda in Hungary in the 1950s.
Bátorfy AttilaNightingale 2020. 02. 12.
ismeretterjesztő közlemény

